VAR Process Automation
This white paper discusses the process a major DOD government contractor uses for their earned value Variance Analysis Reporting (VAR) and the importance of automation. This paper will also help quantify the time and cost savings a customer realized by switching to evData Pro.
The VAR Process Before
The VAR process is a monthly process that includes: collecting the latest financials, calculating the VAR thresholds, filling out the requisite paperwork, acquiring the necessary approvals, and reporting the results back to management. Each CAM (Cost Account Manager) is responsible for one or more financial accounts. Each account has standard earned value financials consisting of BCWS, BCWP, ACWP, EAC, and BAC. The roles on a typical team involved in the process includes; the Financial Analyst, CAMs, and Business Leads. The team was comprised of approximately 80 CAMs, 5 Business Managers and 14 Finance people.
The process before implementing evData Pro was manual in nature. The financials came from a data warehouse and were often loaded in Excel on a shared network drive. CAMs would receive their financials from the excel spreadsheet and would have to perform manual calculations to determine whether their accounts violated their contract thresholds. The contract thresholds were as follows:
Current Month Schedule and Cost Variance Exceeding 3% and $10, 000
Cumulative Month Schedule and Cost Variance Exceeding 5% and $100,000
At Completion schedule and cost variance Exceeding 5% and $100,000
CAMs’ Challenges
If a CAM’s account violated the contract threshold they were required to explain the variances. The explanation would describe why the account was in violation and the corrective action needed to resolve the issue. Figure 1 (below) shows the form each CAM filled out monthly. Once completed, the CAM then approved the comments and emailed the form to the high-level business manager for their approval. This repetitive form was used for each account every month requiring CAMs to type the financials into the appropriate fields.
Errors often occurred such as: wrong financials typed in fields; financials reported in whole dollars or sometimes in thousands or millions, or the wrong calculation was made for determining threshold violations. The process took approximately 4 hours per month per CAM to complete this process. On average, each CAM has approximately 10 accounts to manage.
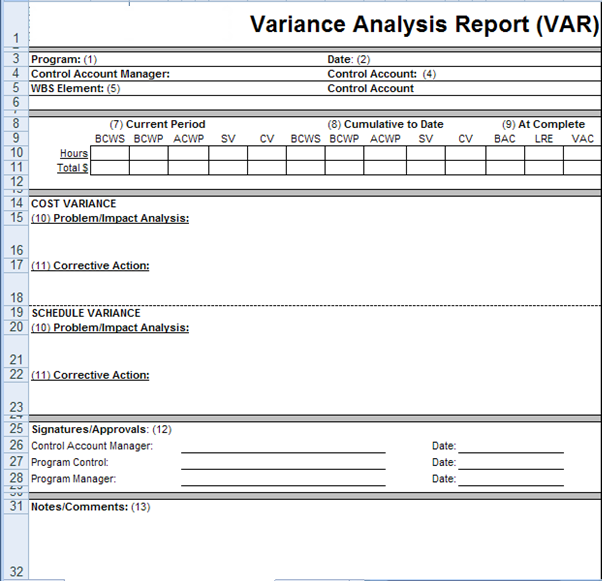
Figure 1 • Excel Spreadsheet
Business Managers
There were approximately 5 Business Managers on the customer’s contract overseeing the team. Business Managers followed up with their CAMs to make sure the process was properly followed. On average, there were approximately 250 threshold violations per month that required VAR comments by CAMs.
Finance
The finance personnel were responsible for converting the financials from the business warehouse into an Excel spreadsheet, a format the CAM and business managers could understand. This spreadsheet was on a shared drive that contained all the financials for each manager. Finance also had to approve and receive all the VAR comments for the entire contract. Finance also had to manually calculate Rate Analysis. Rate Analysis was important to make sure budgeted labor costs were kept in line with the costs actually charged. Turnover of staff meant actual labor rates changed when compared to the original number that was budgeted. One business manager stated the CAM time- savings was 3-4 hours per month.
* Estimate based on interviews with 2 Finance personnel.
After the evData Pro Installation
After evData Pro was installed, the VAR process required fewer steps. The new VAR process starts with Finance personnel downloading the data files from the EVM tool (Cobra or Cost View or MPM). The download file is a standardized format that is imported into evData Pro. Figure 2 shows how data is imported.
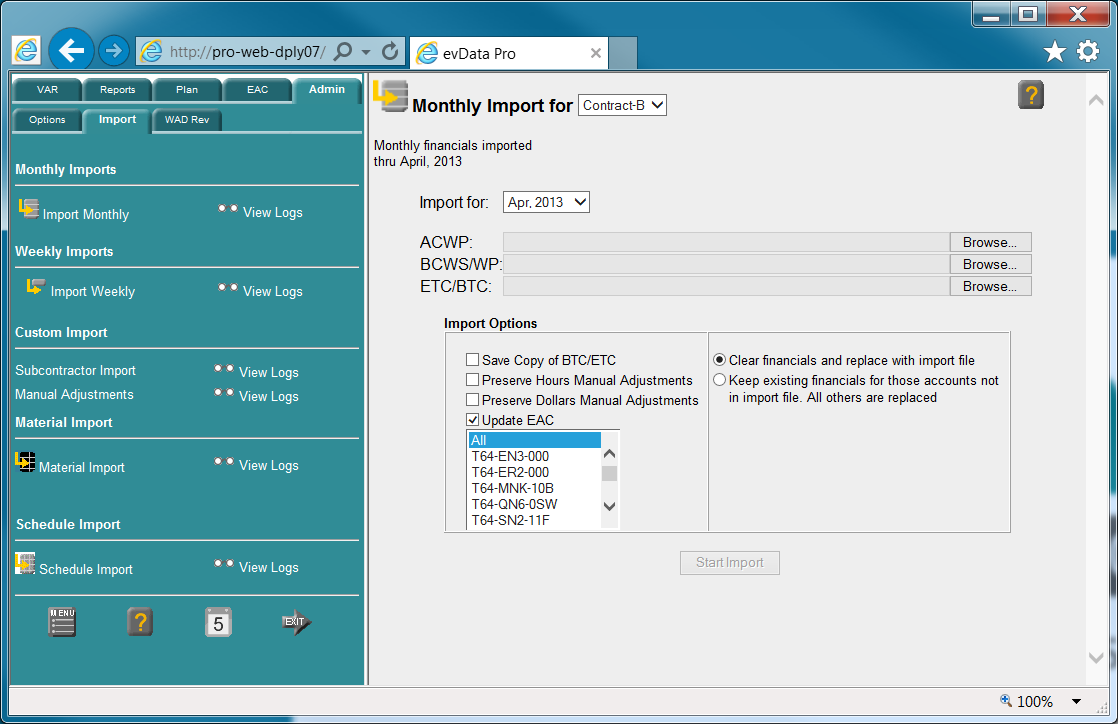
Figure 2
Once imported into evData Pro, all managers can see and view their financials. Business Managers can email directly those managers (see Figure 3) requiring variance comments.
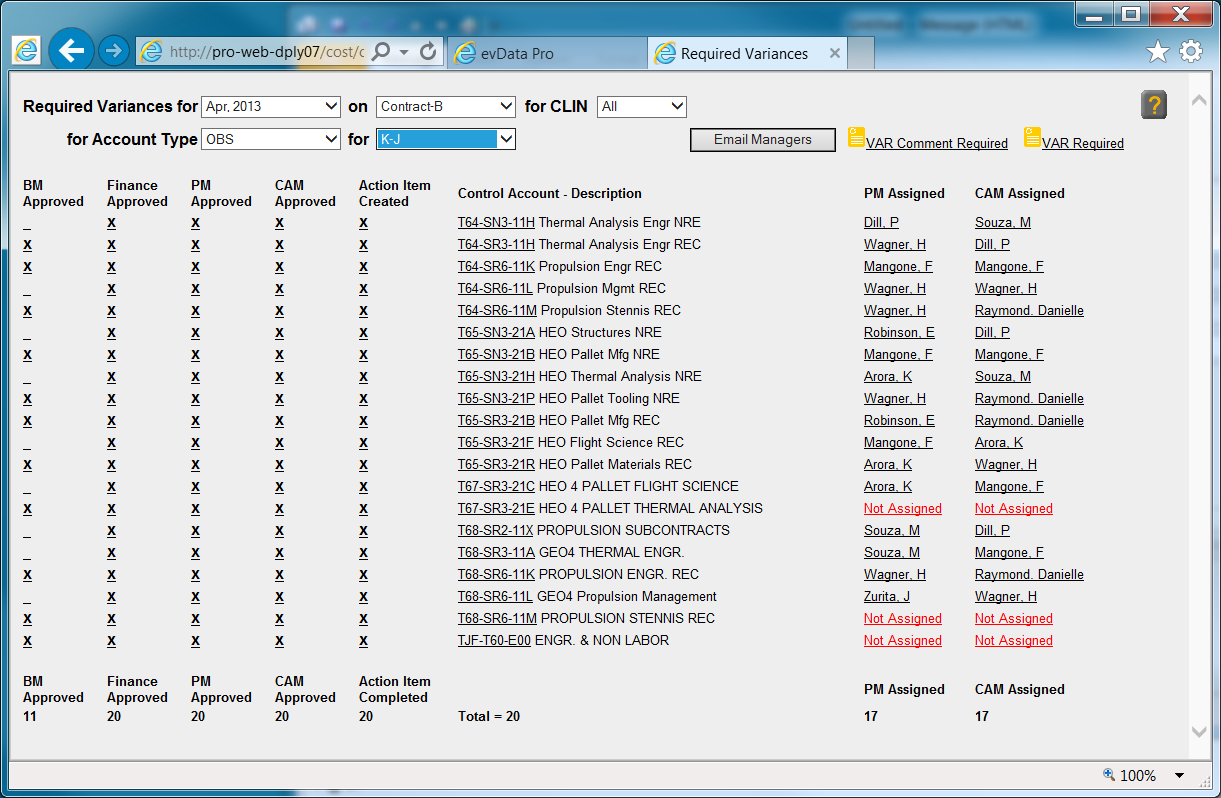
Figure 3 • Approval process via Email to managers regarding un-approved VARs.
The report shown in Figure 4, depicts the area where comments can be entered and are visible to the team.
Highlighted in red are the areas in which CAM and Business Managers need to address.
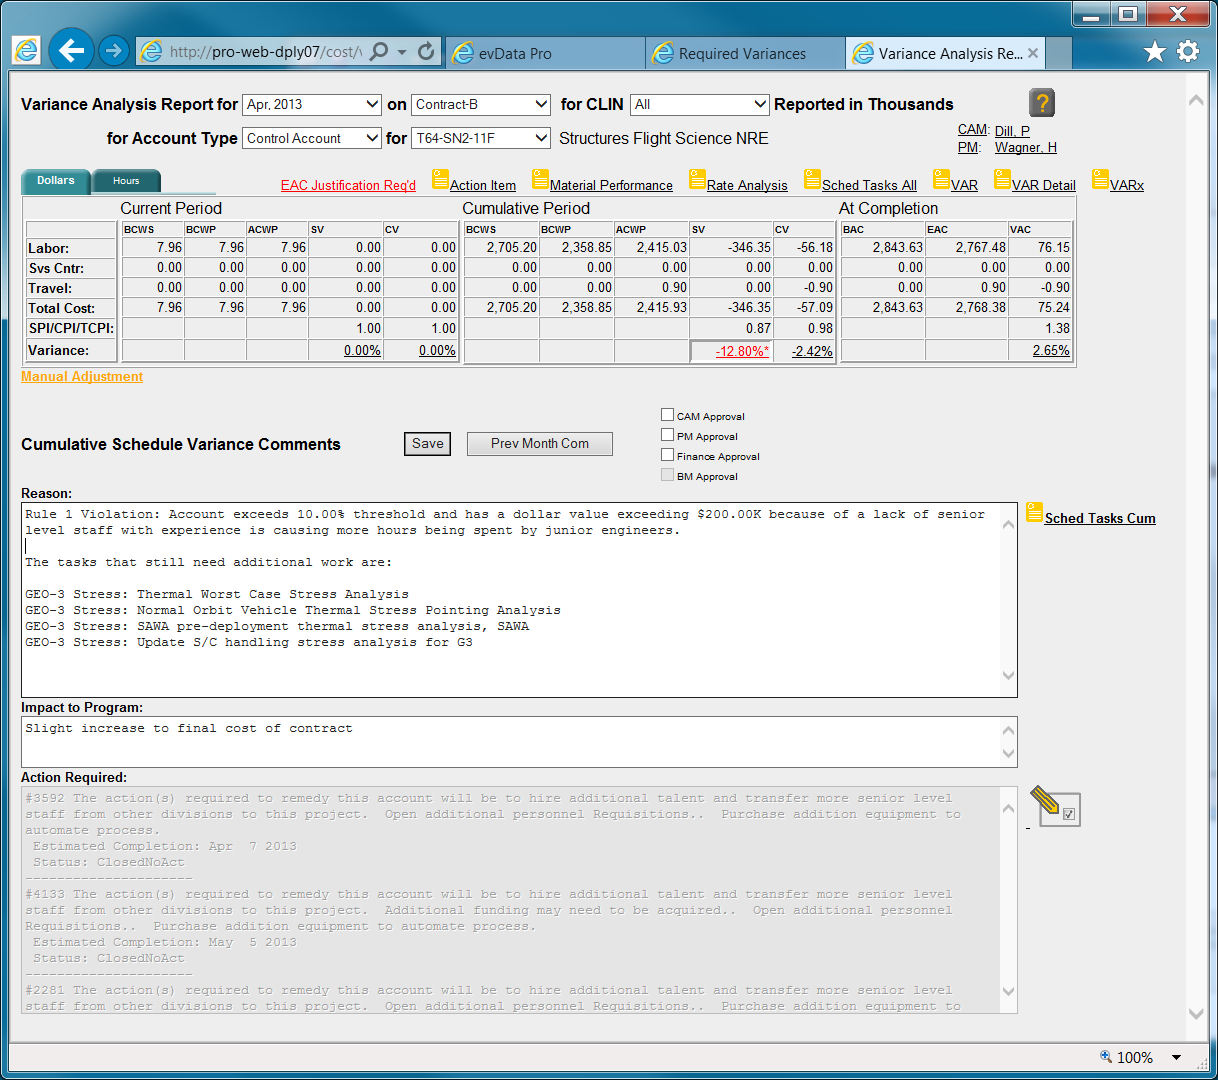
Figure 4 • VAR explanations
Savings
Each member of the EVM team was able to save time. At the end of the first year, a total of 342 hours were saved per month and used for more productive tasks. This equated to a monthly savings of $34,200 per month. That is an annual cost savings of $410,400.
5 Business Managers each saved 10 hours of time per month.
Estimated saving is: 50 hours per month
80 CAMs each saved 2 ¼ hours per month*.
Estimated savings is: 180 hours per month
14 Finance people each saved 8 hours per month
Estimated savings is: 112 hours per month
Total Hours Saved = 342 per month
Cost Savings = 342 hrs *
$100/hour = $34,200 per month or $410,400 per year
*Taken as an average of managements’ and CAMs’ testimonials. (i.e. 3-4 hours by managements’ estimate and 1 hour from CAMs)